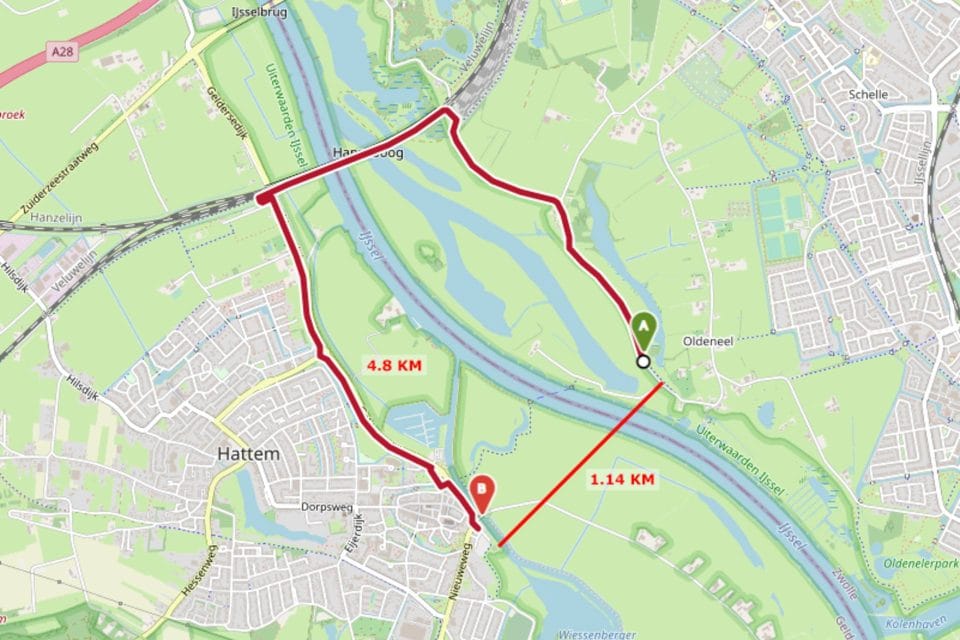
The Analytics tab now contains a heatmap, which can be opened in its own window. This shows all tracker data overlaid on to a map, with heatmapping (red indicates more points and blue fewer) to indicate where participants’ routes have overlapped. This is a great way to see which route choices have proved popular – or to see who has found an inventive/unique route – during free-route events and races, such as The Transcontinental.
Routing Heatmap Added
Want to Learn more?
Visit our support site to explore what our maps can do and discover new features.