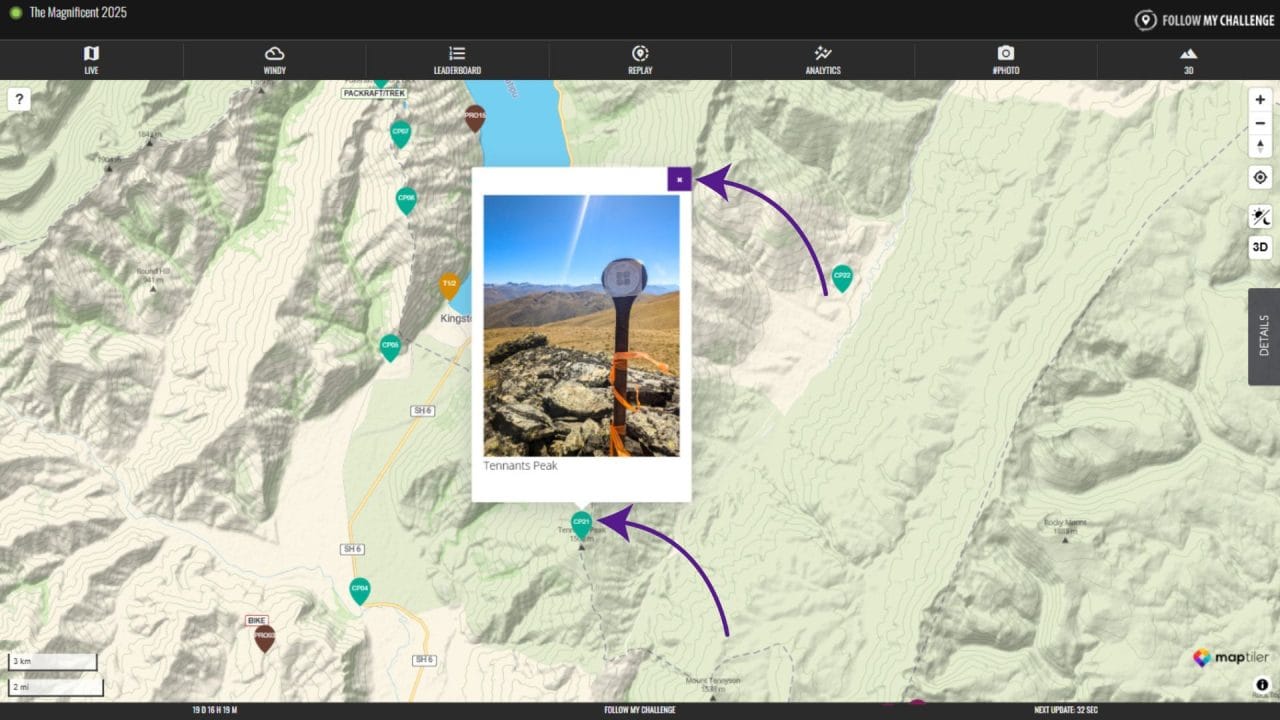
Checkpoint Pop-Ups Added
All new maps now have clickable checkpoint pop-ups enabled. These pop-ups appear beside the checkpoint when the checkpoint is clicked and can contain text, images or links. To close the pop-up, simply click on the “x” in the top right corner. The content within the pop-ups is provided by the event organiser, so not all […]